There’s no doubt that in the 21st century, people have moved on from television towards online streaming platforms (OTT) and the number of options people can choose from to watch movies/shows/sports, etc. online are numerous.
Netflix, Hulu, Disney, HBO, Fox, etc., and a lot more companies are switching to OTT platforms to deliver their content and are driving high revenues. Accessibility to good content has never been easier.
These companies are a dream workplace for any data science enthusiast because the amount of data that flows throughout the business at any point in time has very high volume, velocity, variety, and above all that, very high ‘value’.
In this article, let’s go over a list of things that these companies track and record in their databases to ensure that the Quality of Service and Quality of Experiences is top-notch throughout time.
Just to add, these companies generally work with Big Data because streaming gathers a lot of information about each session, and big companies like Disney and Amazon Prime, etc. take it to the next level by catering to tailored customer experiences so that they know what you want to watch even before you start watching it.
Contents:
- The OTT business and the product
- How much data are we talking about?
- Tools to work with Big data in streaming
- How do companies use your streaming data?
- KPIs in the OTT-business
- EBVS – Exits Before Video Start
- VST – Video Start Time
- VSF – Video Start Failure
- VPF – Video Playback Failure
- Average Bitrate – Streaming Quality
- Total Streaming Hours
- Buffering Ratio
- How do Data Scientists/ML engineers use this data?
- Conclusion
- Further reading
Let’s dive right into it;
The OTT Business and the Product
The OTT or Over the Top business, directly offers content for viewers to enjoy, using just an internet connection. The era of TV has been eradicated by this change in the content-viewing industry.
The business can derive profits out of streaming content – Live or On-Demand, to customers on a ‘one-time-watch’ basis (renting movies) or continuous access (available for as long as the company holds the streaming rights for the content) for a one-time payment or recurring payments in the form of subscriptions (for example – Netflix)
Learn more about the OTT platforms here:
How much data are we talking about?
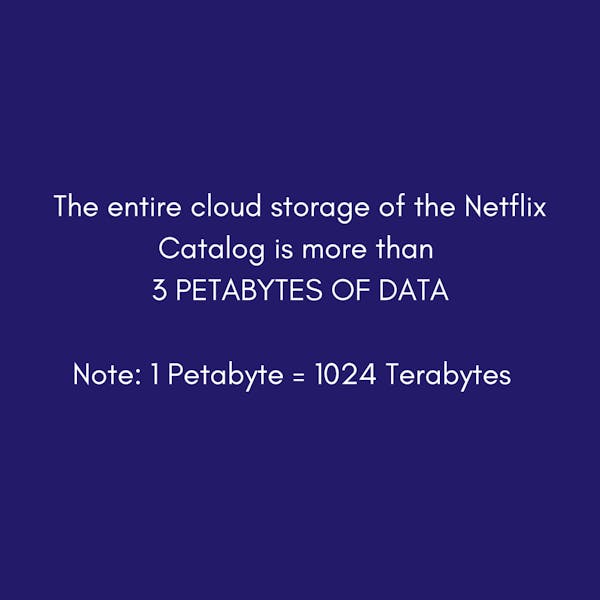
In the OTT business, we’re talking about data that is fast, and very large. This depends on the reach of the company. The data ranges from a few million to a hundred billion or even Trillions of data points that are recorded on a real-time basis. The storage is done using Big Data solutions like AWS or Hadoop/Snowflake etc. to ensure that every data point is recorded accurately.
Companies generally record viewer details, stream details (right down to every single time to watch something), content, and customer details apart from the internal departmental details.
Due to the size of the streaming data, it’s next to impossible to work on it using any tool except SQL to compute any kind of analytics. A Data Engineer’s skills are highly important when accessing such large data on any day. Find out how you can become a data engineer using the roadmap here:
https://aigents.co/learn/roadmaps/
Tools to work with Big data in streaming
Big Data tools to work with streaming data are highly important because the data otherwise cannot be stored/used using routine data solutions. Parallel processing is key to ensure that the numbers or any data recorded by the company is always used in the best possible way and at the earliest.
Today, the tools that can be used with streaming data can include Amazon Web Services (AWS), Apache Spark, Hadoop, Hive, Python, MongoDB, Cassandra, etc.
There are other tools for everyday use like Alteryx or Dataiku that can be used to work with the data as well.
How do companies use your streaming data?
Now, getting to the question at hand. Most of us have never actually realized how the data is recorded or used in any streaming company. What can a streaming company record when you access the platform or application to watch content? For some examples, a company can record the following.
- When do you access the content?
- What content do you access?
- How long do you watch the content?
- What type of content do you watch?
- How long does your content buffer and not play?
- How many times do you visit a certain page or content?
- How frequently do you watch something?
- What’s the mix-up in your watch list or what is your favorite content to watch?
- Your watching patterns for the week or month or year?
- How many times do you sign in?
- What device do you use to watch your content?
- How did you sign up and how to keep you for long?
And a lot more.
This is just for you. But the streaming company (for example Netflix, which has over 220,000,000 viewers) does it for every single customer and then understands them and gives each one of them exactly what they want to watch.
If you have looked into Netflix sometime and found exactly what you want to watch within a minute, that's probably because of how smart the data usage is in the back end.
Product Analytics, Streaming Analytics, Audience Analytics, Session Analytics, Engagement Analytics, Content Analytics, etc., and a lot more happen for all the customers within the company and the interplay among all the different departments helps the company decide what’s the best approach to take to give you the best user experience possible.
Find out a little about the KPIs in the industry below.
KPIs in the OTT-business
Although the size of the data makes it difficult to analyze, with the big data solutions today and the speed at which data is received, it’s important that companies in streaming analyze certain KPIs to ensure that they are tracking their viewers’ behavior 24/7 for a lot of different markets and content types.
A few KPIs that help in delivering a high-quality service are given below.
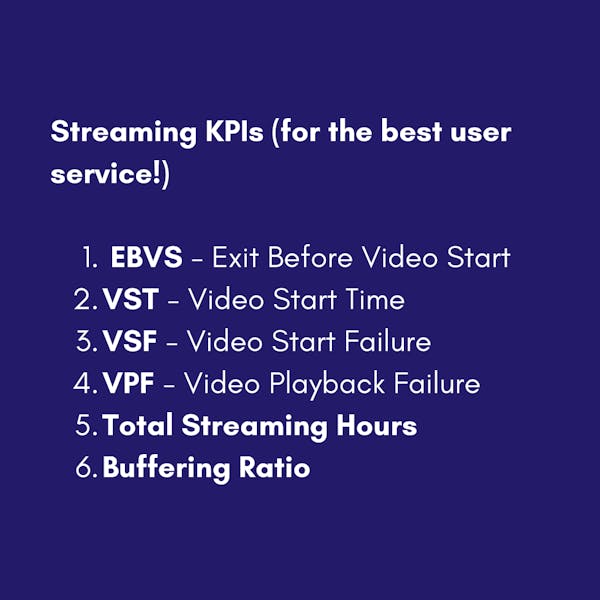
EBVS – Exits Before the Video Starts (customer failure by choice to play content)
Every time you exited before the first frame of the content plays, that’s calculated as an EBVS. The number correlates directly with the next KPI, video start time (VST)
Ideally, there’s no industry standard for the EBVS itself but the ratio of EBVS to total attempted plays ideally should be anywhere around 5% to 10%
VST – Video Start Time (before the first frame plays)
The video start time relates to the time taken for the first frame to appear on the screen provided there’s no error. The higher this number is, the higher the chance that a viewer exits before the start of the video (EBVS)
With higher internet speeds this metric sees a fall every year, the benchmark here can be anywhere from 4 to 6 seconds.
VSF – Video Start Failure (Technical errors in the streaming platform/app)
There’s no doubt that the number of viewers, especially in these live games, put even streaming technologies at the edge and there are chances that due to any reason, there may be technical difficulties viewing certain content playing on the platform, this is an important KPI that streaming companies track to ensure their customers don’t face any problems streaming the content at any point of time.
VSFs can be anywhere between 0 to 2% of the total playback attempts (with better technology behind the playback, this metric sees a decline)
VPF – Video Playback Failure (Non-technical errors in the streaming platform/app)
Have you ever had a time when you noticed that a particular video wouldn’t play on YouTube or Netflix, but every other video would play well? It occurs due to file corruption or any missing bits in the content itself, and therefore, these are non-technical errors that are recorded by the company to ensure that while the technicalities flow without any issues, the content must be available to all the customers at all given points of their access to the platform.
VPFs are like VSF in terms of the % because companies have their content in scalable cloud storage today that allows quick access to the content and ideally does not let the content have any problem whatsoever.
Bitrate – Average bitrate during the stream (higher the bitrate, better the quality of content)
A good internet connection and a better bitrate, that’s the recipe for the best content. The more bits you see per second of the stream, the better your viewing experience. The difference-maker in most streaming companies, the benchmarks keep improving every year because of better devices, better internet speeds, and better visuals in content to deliver to the customers.
For 60FPS with 1080P FULL HD viewing experiences, the bitrate can be anywhere above 4500 or 5000 bits per second. For 30FPS with 1080P FULL HD viewing experiences, the bitrate can be anywhere above 4000 bits per second. The threshold for 720P HD viewing is above 1500 bits per second.
Total Streaming Time
When your playback runs error-free, your session is recorded to find out your entire streaming time. This updates to calculate your buffer time and your playback time separately along with any other interruptions or pauses you may have in your time with the content. This helps the company rank its content and show you what the entire world is watching.
For example, in the holiday week of December 2022, starting 19th December, the movie “Knives Out – Glass Onion” was streamed on Netflix for a whooping 82 Million Hours all over the globe.
Buffering Ratio
The buffering ratio helps the company understand the lapses that happen in the stream and can help them modify their streaming engines to provide a better average bitrate so that your user experience is not hampered in any way. This is simply calculated as a ratio of the buffer time you experience during a session to the entire streaming time.
The lower the buffer ratio, the better. This does depend on multiple factors otherwise.
Find out more about the KPIs here: Streaming KPIs Guide - Conviva
How do Data Scientists/ML engineers use this data?
Data Scientists and Machine Learning engineers use the data recorded in streaming to understand a customer’s viewing patterns and high-level models such as Reinforcement Learning and Deep learning etc. are built on the data to predict a customer’s viewing behavior and understand how the customer will stay for longer on the platform.
ML teams and DL engineers today work to ensure that the platform can upscale whenever required to deal with the higher bandwidth and also that the system can use the shared resources of streaming optimally so that the customers get all the content that they want to watch as and when they need without any problem.
To an extent, these models when clubbed with the customers' engagement data, also help a customer make the choice of "what to watch?"
For example on Netflix, machine learning is used to analyze your movie and series choices. For example, if you watch an episode of a certain series, say a high school drama series, or if you like thumbnails that have images of cars, then its highly likely that it is similar things that will be presented to you as a part of your customer experience in your time ahead with the platform. Although it may not be possible for every other streaming company to scale their MLOps and AI intelligence like Netflix, there’s no doubt that the code to make a custom view more content has been cracked.
Conclusion
As simple as streaming content is today, the story on the other side is marvelous in terms of the use of data. It’s no doubt that a curated customer experience with the use of data pushes customers to spend more time on the platform.
With Machine Learning entering the picture, the data points of the user can be used in any way to change the product pricing, strategies, and reinvestment methods to ensure that the revenue keeps flowing in into the business.
Every company does it, only streaming companies must do it faster and on a whole different scale.
Further reading
Most companies publish their streaming information online, with some of the most interesting insights and information about streaming analytics being shared by Conviva, a company that delivers streaming optimization solutions to their clients. Find the Streaming Report of Q1’2022 in the following link and see how the streaming industry performed at the time and which events/devices were the game-changers!
https://pages.conviva.com/rs/138-XJA-134/images/Conviva-State%20of%20Streaming-Q12022_Final.pdf